GPT Crypto Data Guide #6

In the past five lessons, we learnt how to:
- Query aggregated Dune Spell data (e.g. all NFT trades)
- Analyse decoded project data (e.g. all Aave data)
- Pull insights from raw blockchain data
- Utilise Dune’s token price data
To finish this series, we will learn how to design Dune dashboards that effectively communicate our research. I will share some best practices on dashboard design and then guide you through creating your first dashboard.
Dashboard Design
Here are some tips on how to build a great dashboard. I’ll use Hildobby’s Staking dashboard as an example of best practices.
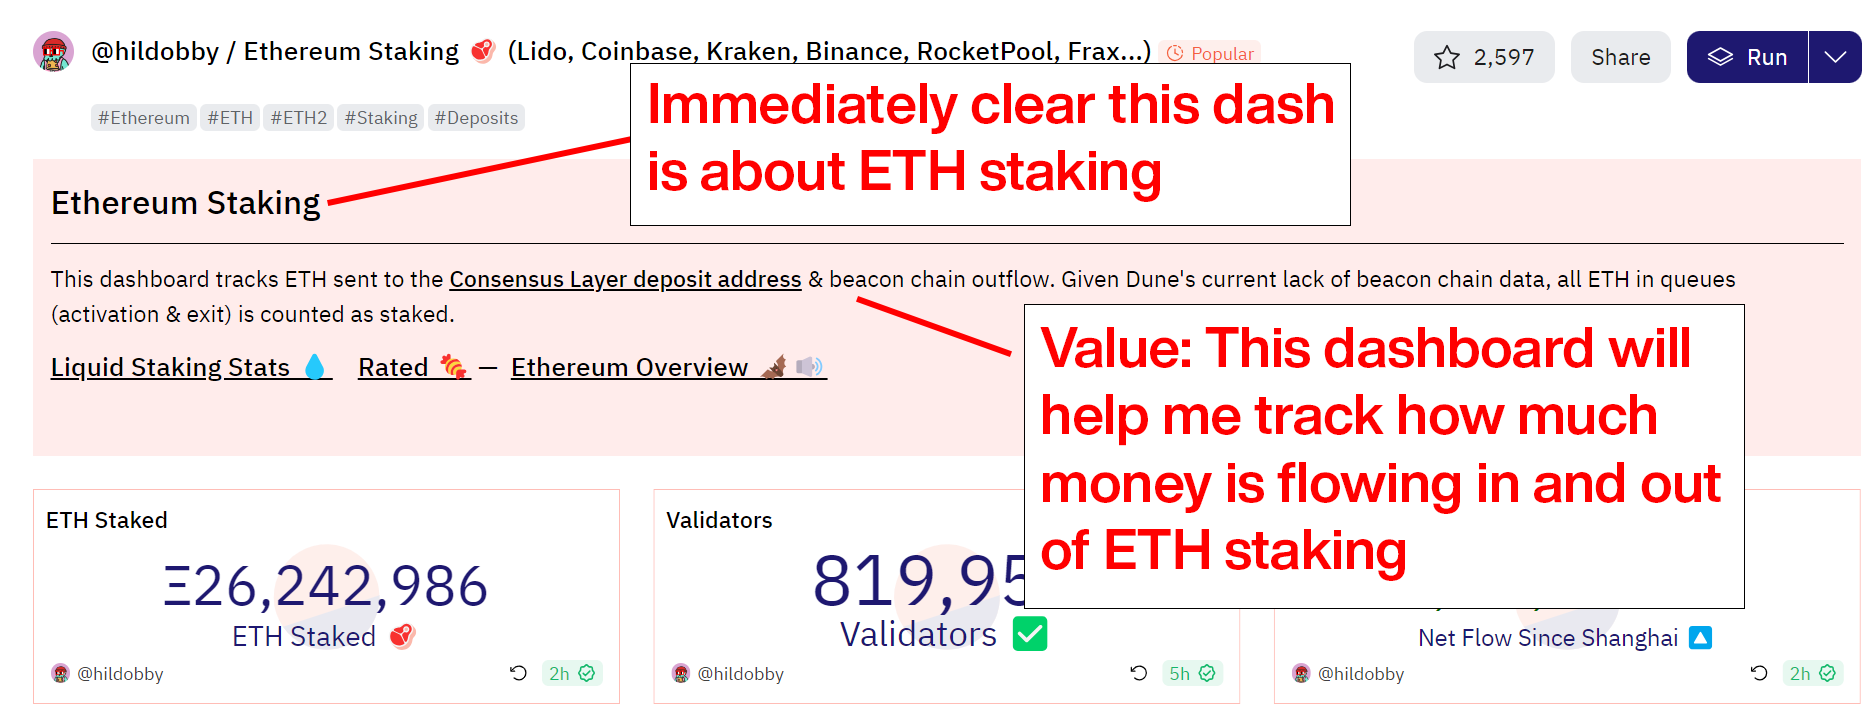
1/ Have a header with a clear title and a description
Make the value of the dashboard obvious using a clear header. When I visit your page, I should know within the first few seconds; “What am I going to get out of this?” and “How can this help me?”.
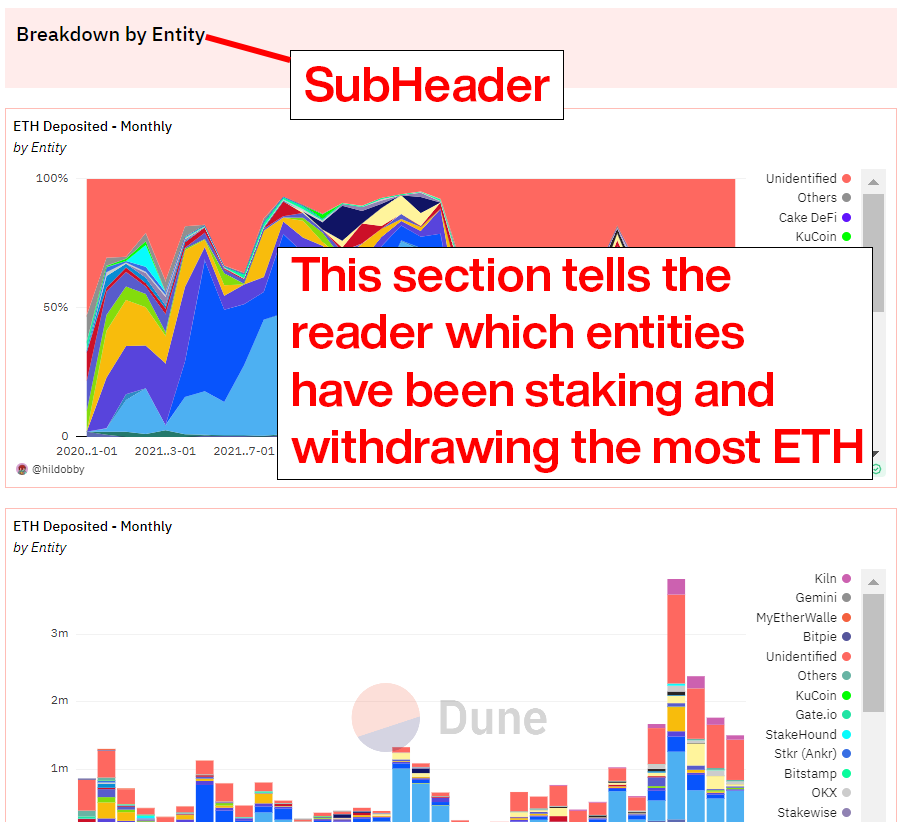
2/ Break your dashboard into sections
Your dashboard should tell a story. Stories have chapters. A simple rule of thumb is:
- Start with a section that provides a high-level overview of the topic. For example, if it is a dashboard about NFTs, the first section could display data such as “How many NFTs have been sold?” and “How much trading volume is there?”
- Follow this with sections that delve into specific questions your users might have. For example, someone viewing a dashboard about NFTs might want to know, "What NFT marketplace has the most volume?" or "How much have NFT artists earned in royalties?". Each question can be the basis for a section with charts that answer it.
Divide your sections using subheader blocks.
3/ Within each section, select the most appropriate chart types for the information you want to convey.
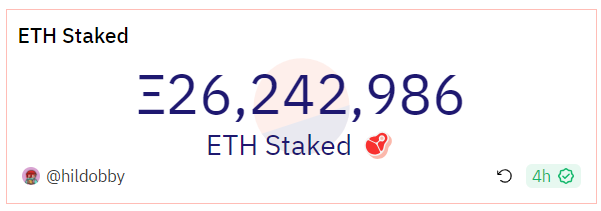
Counters are great for sharing single headline stats.
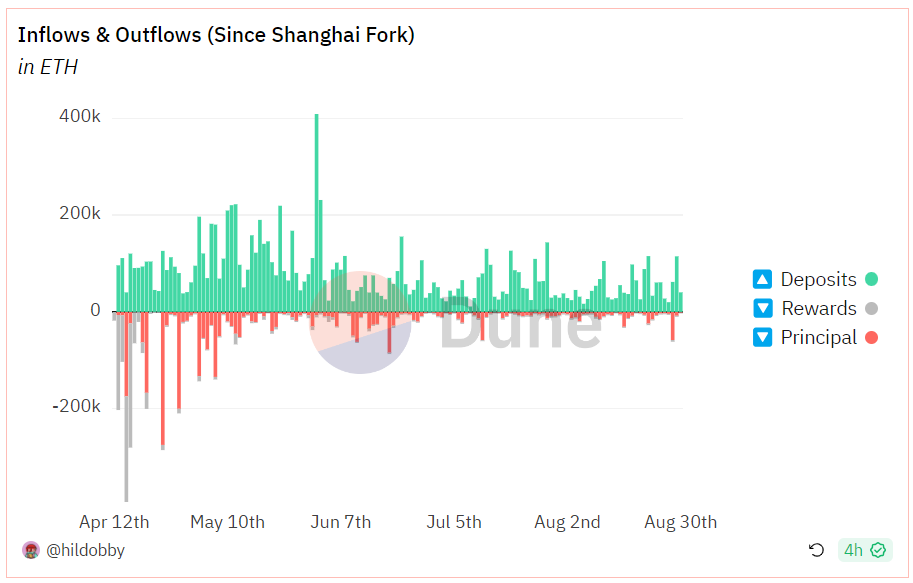
Bar charts are great for presenting the volume of money flows or the quantity of a specific action over time.
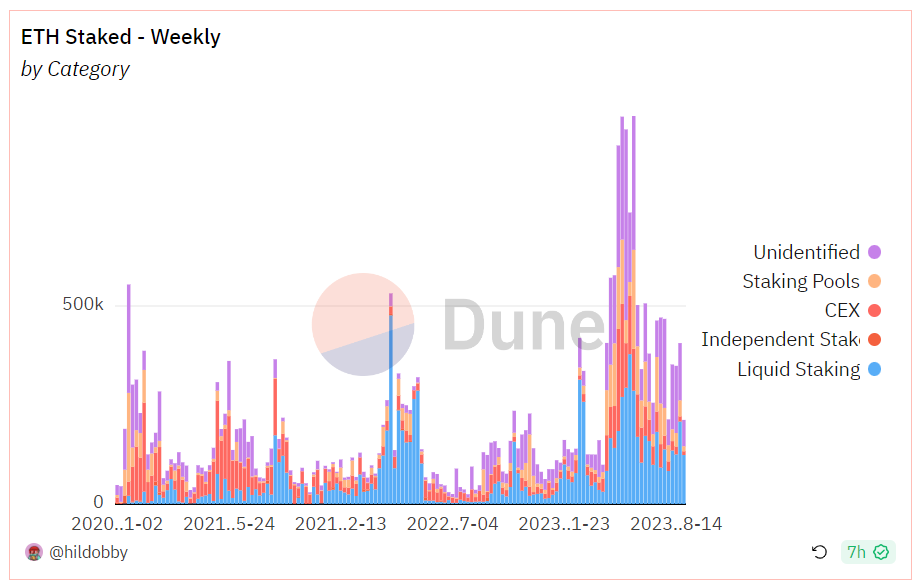
They are also useful for comparing inflow and outflow volumes over time.
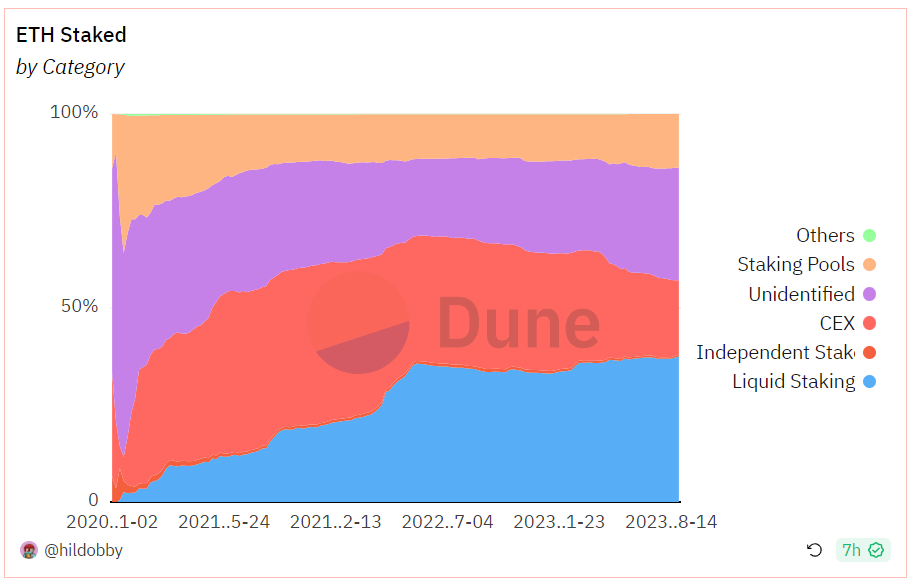
To compare the market share of different entities, use a stacked percentage bar chart.
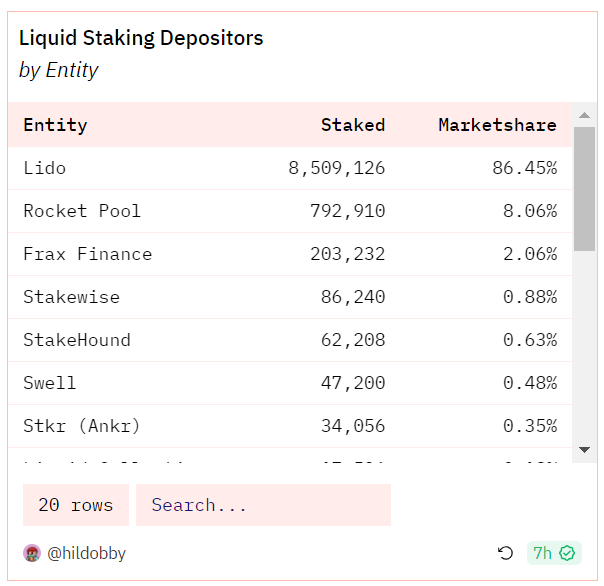
Use a table to present a list of events or a ranking of entities according to some statistic.
Try it out
Now that you understand how to design a great dashboard, try creating a dashboard about a topic that interests you.
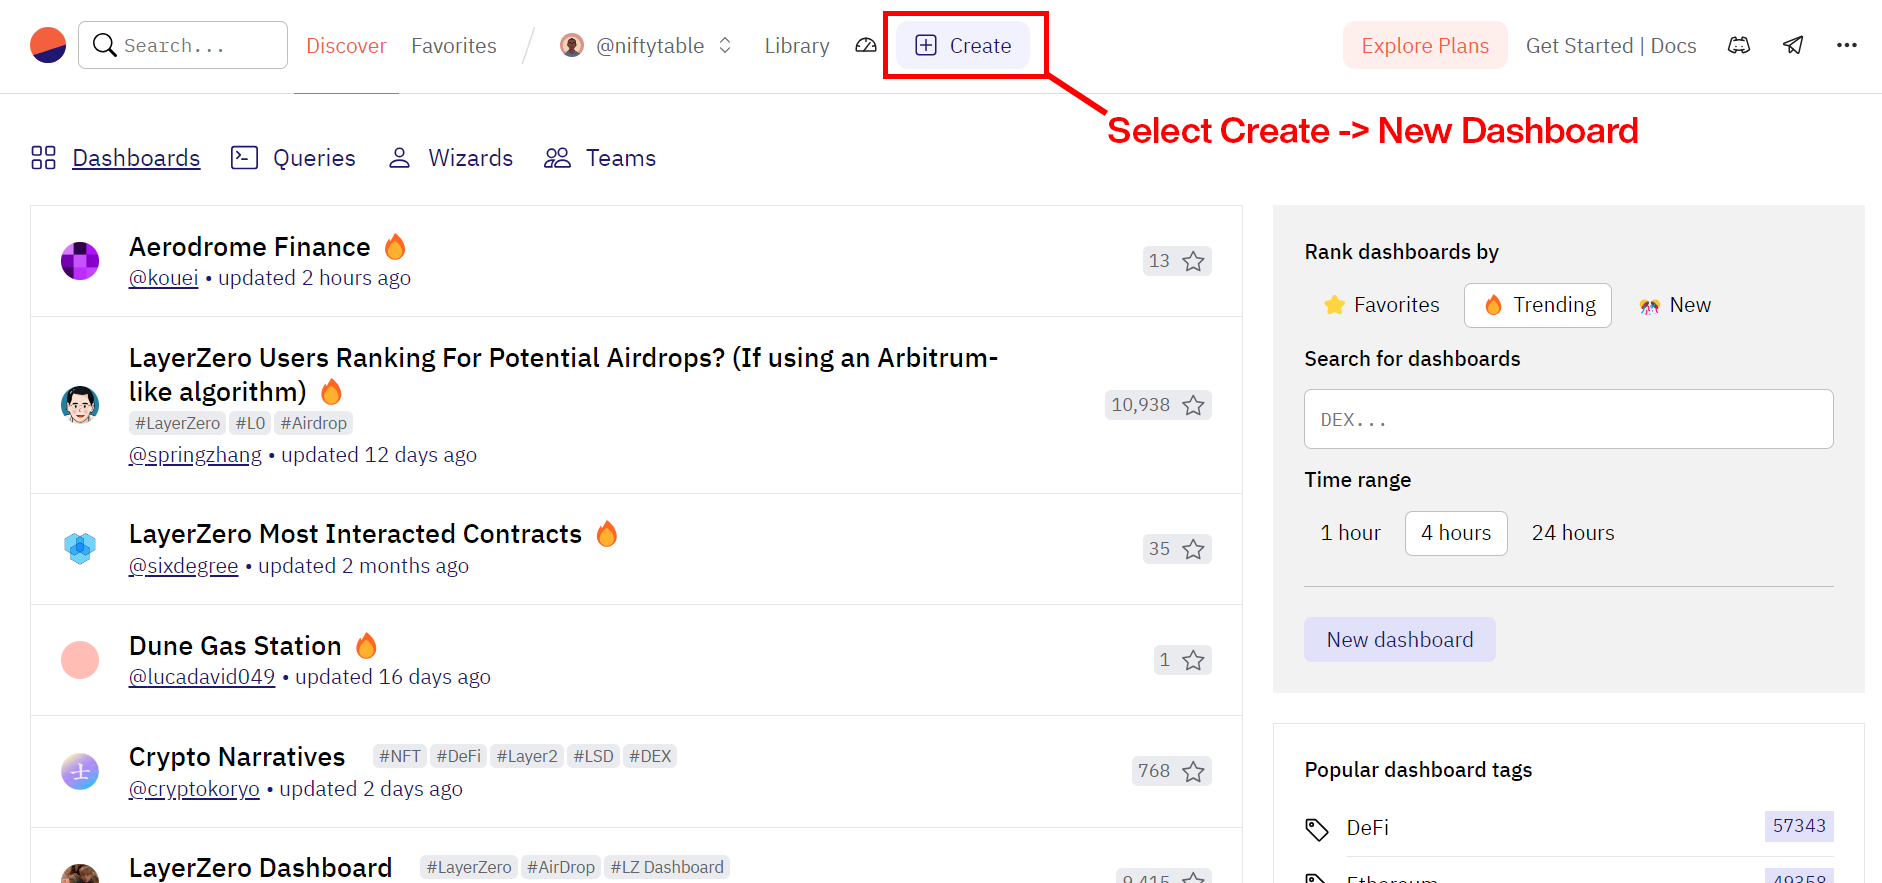
1/ On the Dune site, hover over the Create tab in the top menu and click on New Dashboard when it pops up.
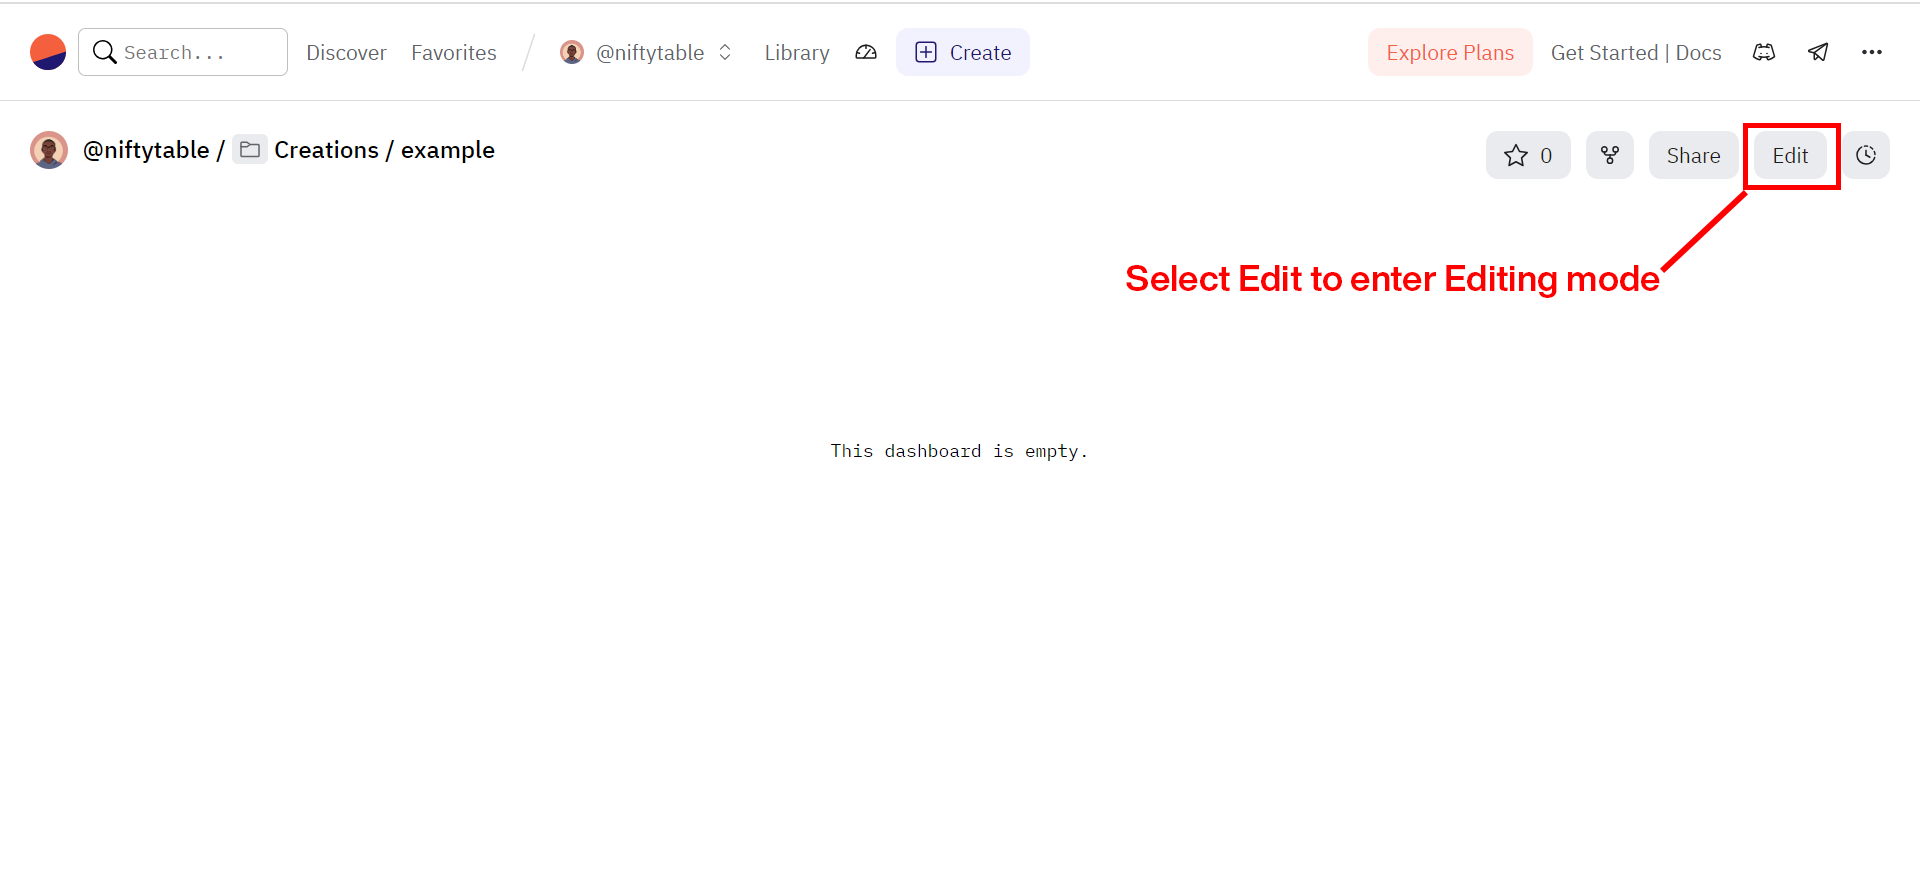
2/ Click the Edit button to enter editing mode.
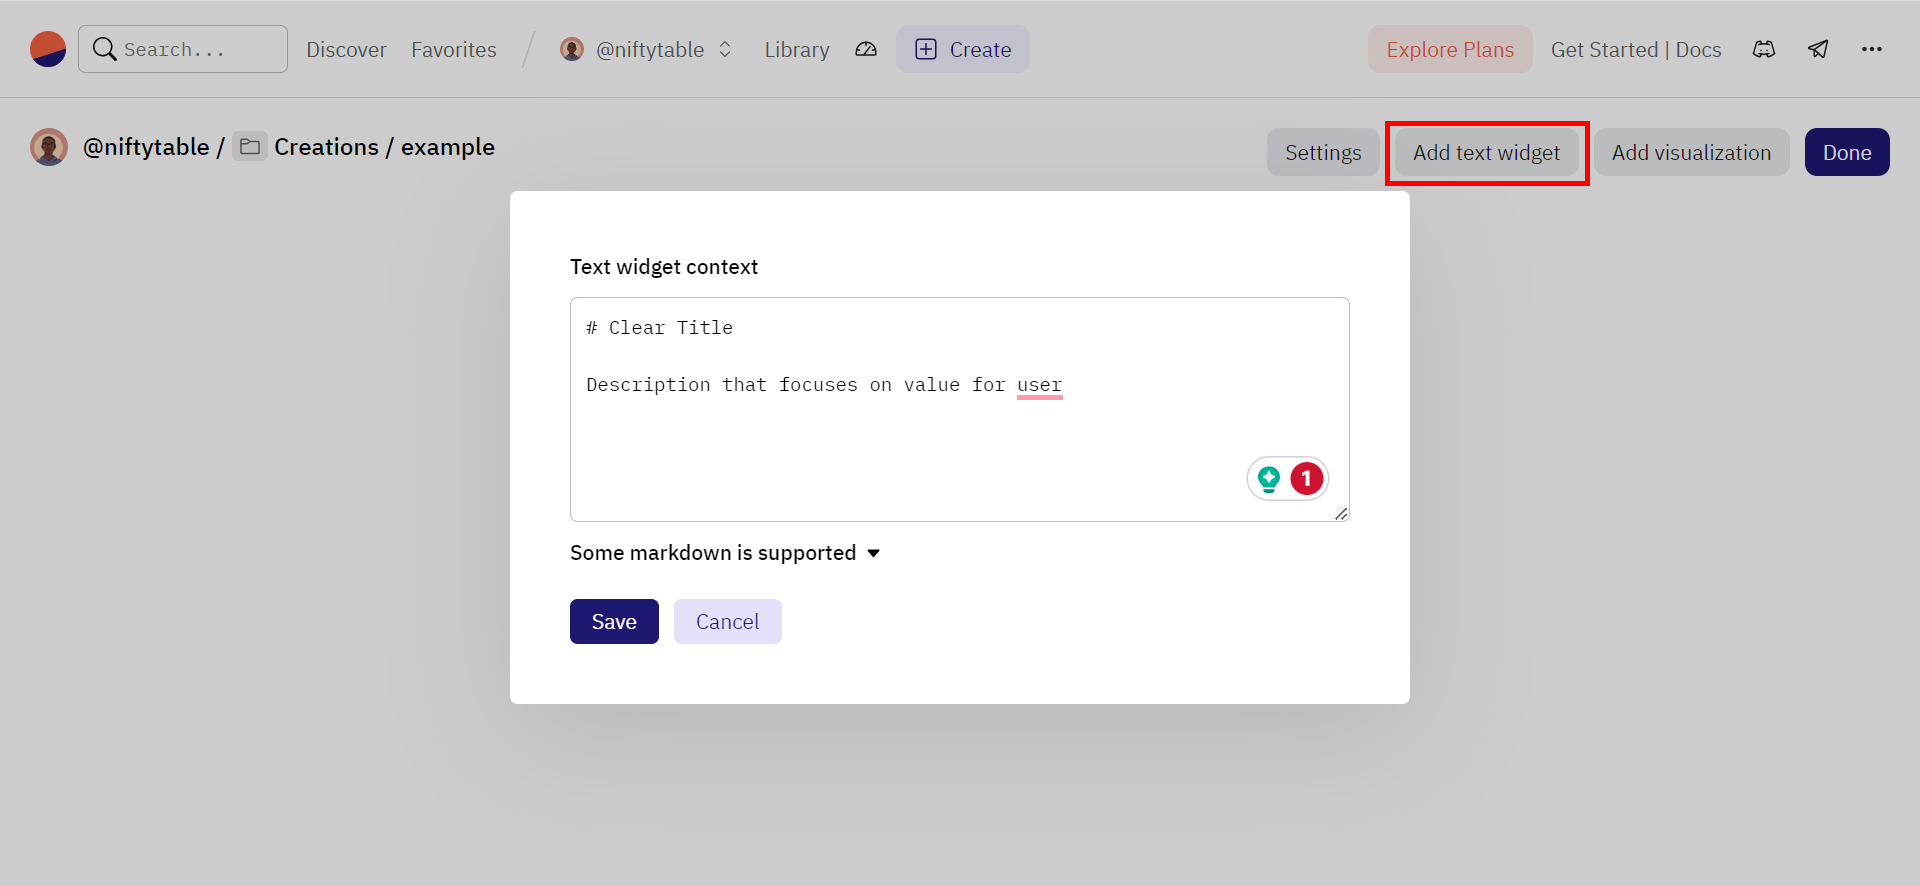
Select Add text widget to make a text block for your header and description. To style your header as a Heading, put a # before the title. Resize the block by dragging its bottom right corner.
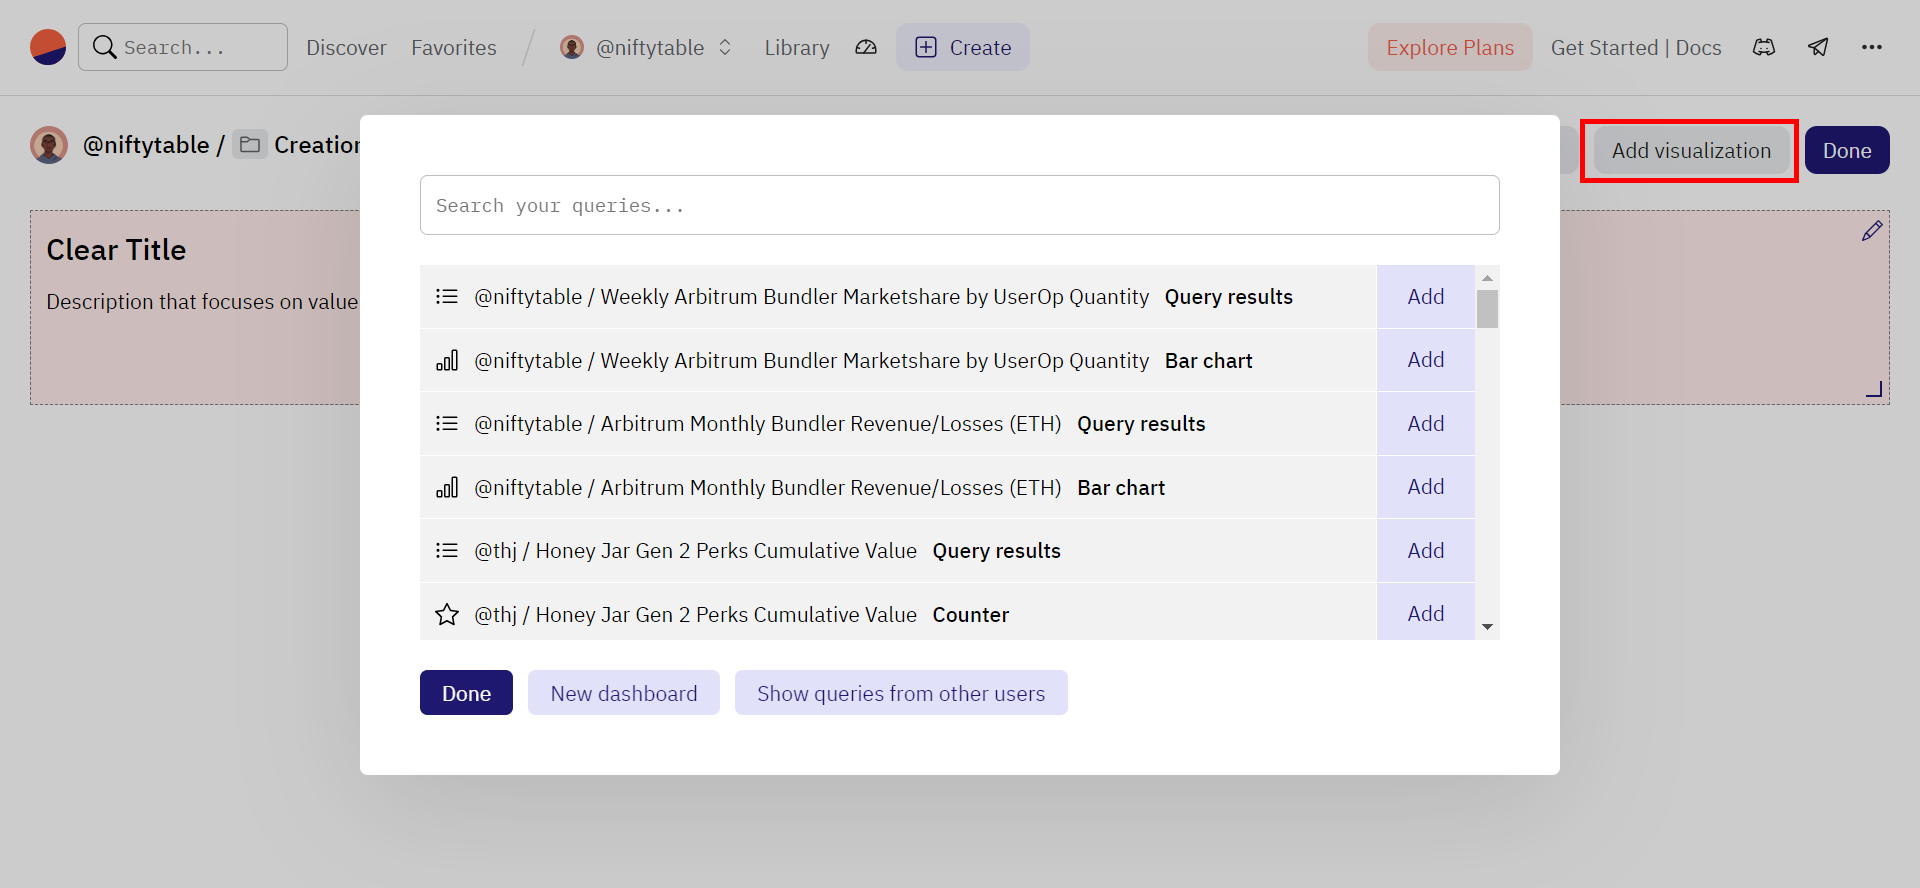
3/ Add some charts. In edit mode, select Add visualisation. Search for and add charts you have created that present a general overview of this topic
4/ Add some sections using text elements to create subheadings and Add visualisation to add charts.
Congrats, you've reached the end of the GPT Crypto Data guide!!! 🥳
This is just the start of your journey. Use what you've learned here to generate your own crypto data research!
The prompts in this guide will also work with other data platforms.- For example, you can use them on Flipside, but you must specify that you want Snowflake SQL queries instead of TrinoSQL and that addresses are strings instead of varbinary.
Dune has beta-launched an inbuilt LLM tool now. I'll publish an updated version of this guide in the near future, which will demonstrate how to use that tool instead of ChatGPT for generating queries (basically the same prompts, but you won't have to specify that it's TrinoSQL or the data type of addresses).